
Cohort Retention Analysis for Studios: A Practical Guide
! Studio owner comparing cohort retention spreadsheet
Cohort retention analysis groups your clients by when they started, then tracks how many of each group keep coming back.
Ever felt that gut punch when a client who loved their first class just... disappears? You know they liked it, you know your service is top-notch, but the revolving door keeps spinning. It's infuriating, and for busy Aussie studio owners managing everything from bookings to BAS, it feels like an unsolvable mystery.
Forget hunches and blurry overall averages. What if you could pinpoint exactly when clients are ghosting you, and why? That's the power of cohort retention analysis - a practical, surprisingly straightforward tool that groups your clients by when they started, then tracks how many of each group actually keep coming back.
For any spa, recovery centre, yoga, Pilates, or dance studio owner in Australia, this isn't just a fancy metric. It's your secret weapon to understand if those new intro offers are sticky, if your membership perks are working, or if your onboarding process needs a serious overhaul. You can build one of these tables in a spreadsheet, but an all-in-one spa booking software makes it even simpler.

The Blind Spots of "Overall Retention"
Relying on one overall retention number is like trying to diagnose a leaky pipe by looking at the entire building's water bill. It blends everyone together - the brand-new, the loyal lifers, the once-off visitors - and obscures crucial patterns.
Think about it:
- Hidden Exodus: A healthy average can easily mask a rapid exit of new clients if your long-term regulars are consistently staying. Stripe's Australian guide highlights how these blended averages often hide concerning trends.
- Growth Distortions: If you're smashing your growth targets and signing up stacks of new clients, your overall retention might dip. Why? Because newer customers, who naturally haven't had time to "retain" yet, make up a larger slice of the pie. As Metabase explains, this isn't necessarily a sign of a problem, but it looks like one.
Cohort analysis fixes this. It treats each group of new clients as its own mini-experiment, measured against its own starting size and 'age'. This way, you clearly see if your January intake behaved differently from your July intake, and at what point they typically stopped coming back.
Setting the Scene: Defining Your Cohorts & Returns
Before you dive headfirst into a spreadsheet, two key decisions will shape your insights:
Pick Your Starting Event
The most common approach, as described in LM Group's guide, is to group clients by the month of their first purchase or signup.
For studio owners, we recommend focusing on the month of their first completed visit or attended class. Why? This filters out no-shows, unused intro offers, or clients who only bought retail. We're interested in people who actually experienced your service.
Pro-Tip: Once you've nailed the basics, you can slice your cohorts even further - by the specific entry offer (e.g., an intro pass versus a direct membership), which can reveal powerful insights into which acquisition strategies attract the stickiest clients.
Pick Your Return Event
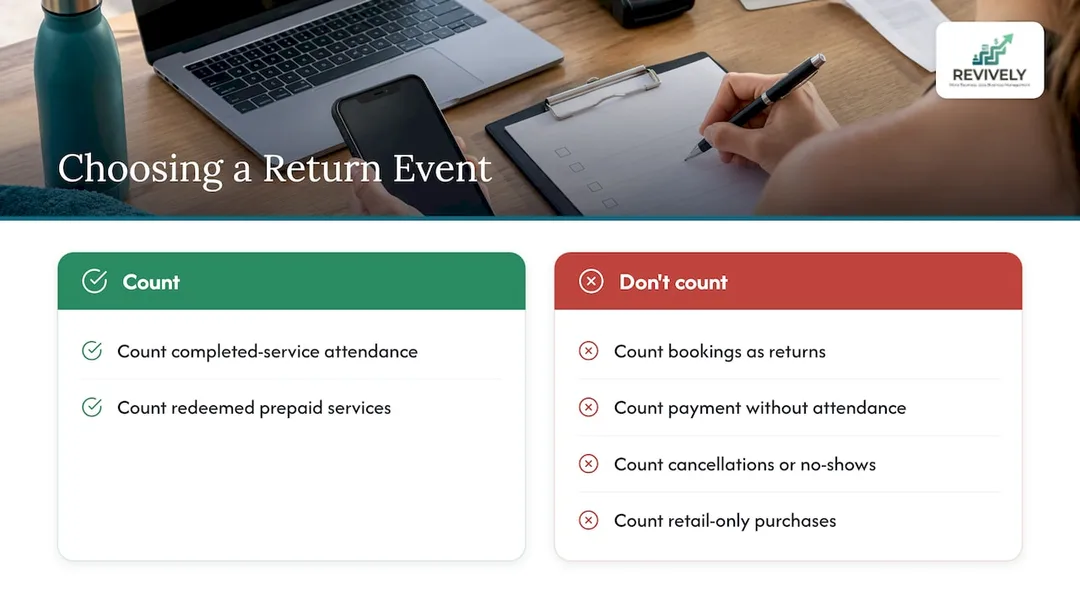
A "return" needs to match the core question you're asking. A booking, a payment, and an attended visit are vastly different signals. American CSS strongly recommends counting actual attendance - a completed service or class - rather than just a payment or booking. Exclude cancellations, no-shows, or purely retail purchases. A redeemed prepaid service, however, absolutely counts.
This distinction is crucial for class packs. A client who bought ten classes in March but attended none in April has paid, but they haven't returned to your studio. What we care about is engagement, not just transactions. Count attendance.
Building Your Cohort Table, Step-by-Step
You'll need an export from your multi-resource studio scheduling software with just three columns: client ID, the date of each completed visit or class, and the date of their first ever completed visit. Most robust studio software, like Revively, holds all this crucial data in your customer profiles and booking history.
Here's how to construct your table:
- Assign Cohorts: For each client, identify the month of their very first completed visit. This is their "cohort month".
- Calculate Visit Age: For every subsequent visit, determine how many months have passed since their cohort month. Their first visit month counts as "Month 0".
- Count Unique Clients: For each cohort and each 'age' month, count the unique clients who had at least one completed visit. (A client who visits five times in a month still only counts as "one active client" for that month).
- Calculate Retention Percentage: As LM Group describes for pivot tables, divide the count of active clients in a given cohort/age by that cohort's initial Month 0 size. Multiply by 100 to get a percentage.
The formula is: (Active Clients in Period / Original Cohort Size) * 100. Shopify's guide provides a solid example of a group starting at 1,000 clients, dropping to 800 (80% retained), then 600 (60% retained).
Conversely, Churn for a cohort is simply 100% minus the retention percentage.
Here's a snapshot with illustrative, made-up numbers for a bustling Pilates studio in Perth:
| Cohort (First Visit Month) | Starting Clients (Month 0) | Month 1 Retention | Month 2 Retention | Month 3 Retention |
|---|---|---|---|---|
| July (2023) | 40 | 55% | 45% | 40% |
| August (2023) | 36 | 58% | 47% | |
| September (2023) | 44 | 66% | ||
| October (2023) | 30 |
Notice the blank cells? That's because these periods haven't happened yet for the newer cohorts. As Metabase notes, recent cohorts will naturally have empty columns later on, giving the table its characteristic triangular shape. Consider shading your cells from light to dark - it's a visual heatmap that can instantly highlight problem areas.
Decoding Your Retention Table: What the Curves Tell You
This table isn't just numbers; it's a narrative of your clients' journeys. Here's how to read its story:
- Read Down a Column: This allows you to compare different cohorts at the same age. How did your September Month 1 retention compare to July's? This tells you if recent changes are actually making a difference for new clients.
- Read Across a Row: This reveals one cohort's entire retention curve, showing you the typical lifecycle of clients who joined in that specific month.
Now, for the key insights:
- A Steep Drop from Month 0 to Month 1?
Churnfree identifies this as a classic sign of onboarding or activation issues. Clients aren't finding value fast enough, or the next step isn't clear. For your studio, this could mean a confusing first class experience, a slow intake process, or no obvious prompt to book their next session before they even leave. - A Slow, Steady Decline Across Every Age?
This usually points to broader value or pricing concerns, rather than a specific onboarding hiccup. Perhaps your membership tiers aren't quite hitting the mark, or perceived value diminishes over time. - A Curve That Flattens Out?
Excellent news! This indicates that clients who make it past a certain month tend to stick around for the long haul. Identify what these clients have in common: Are they all on a recurring membership? Do they have a regular weekly slot? Use these insights to encourage others to adopt similar behaviours. - A Significantly Better Month 1 in Newer Cohorts?
In our example, September's Month 1 retention (66%) is much higher than July's (55%). This is a strong indicator that something you changed - a new welcome email, a clearer call-to-action, a revamped intro offer - is genuinely working.
For a quick spot-check on your arithmetic, a conversion rate calculator can help you verify any of the values in your calculations.
Common Mistakes That Skew Your Data
Even with the best intentions, it's easy to misinterpret cohort data. Avoid these pitfalls:
- Treating Blanks as Zeros: A cohort that's only one month old hasn't failed at Month 3. As American CSS advises, either exclude these unfinished periods or clearly mark them as preliminary.
- Comparing Apples and Oranges (Different Ages): Never compare July's Month 3 retention with October's Month 1. Always compare Month X with Month X across cohorts.
- Trusting Tiny Cohorts: Percentages derived from small groups are inherently noisy and unreliable. Metabase warns against this. If your boutique studio only adds a handful of new clients each month, group them by quarter instead of monthly to get more statistically significant numbers.
- Averaging Percentages: Combining cohorts requires using raw counts or weighted averages. American CSS explains how simply averaging percentages can lead to misleading conclusions.
- Mixing Payment Failures with Real Churn: A client whose membership lapses due to an expired credit card is involuntary churn, not a reflection of your service value. As Churn.io recommends, separate these out. They need a payment reminder, not a new retention campaign.
Turn Insights Into Action: Testing for Better Retention
Once you've identified the "drop-off" point in your retention curve, it's time to test solutions. Pick the month where the steepest decline occurs, and then implement a change just before that point.
Churnfree suggests testing an onboarding tweak or a specific check-in, then comparing the next two or three cohorts at the affected period to see if your intervention moved the needle.
For your Australian studio, this might look like:
- Immediate Re-engagement: A warm welcome message and a prompt to book a second visit before the new client even leaves their first session.
- Timely Nudges: A targeted reminder sent a week before an intro pass expires, highlighting its remaining value and the next steps.
- Value-Driven Upsells: Proactively moving class-pack buyers onto a more beneficial membership once they've used most of their credits, showing them the long-term savings and commitment.
Want more practical strategies for keeping clients hooked? Dive into our guides on spa retention strategies, mastering selling class memberships, and the essential studio KPIs that predict revenue. You'll find even more insights under our customer retention tag.
Revively's View: Beyond the Numbers, It's About Operations
Most Australian studios obsess over revenue and bookings, yet still can't tell you when a new client stops coming, let alone why. The problem? Data scattered across disparate systems: bookings in one tool, payments in another, class attendance scribbled on a physical sheet. This fragmented approach makes meaningful analysis a nightmare.
We built Revively as an Australian-made, unified cloud command centre precisely to solve this. Your client's first visit, every class attended, their memberships, and class packs all live in one place. When your records are connected, generating a powerful cohort table becomes a simple export, not an all-day project.
But retention isn't just about data; it's mostly about smooth, client-centric operations. An automated waitlist that notifies and books clients instantly, a streamlined intake form, or perfectly timed reminders for upcoming classes or expiring passes - these seemingly small operational details profoundly shape whether someone returns for that crucial second visit. These are the practical, real-world details we obsess over at Revively.
Andreea, Founder of Revively
Keep Your Client Data in One Australian-Compliant Place
Cohort analysis is only powerful when your first visits, attendance records, and payments are captured consistently and securely. Revively brings recurring classes and waitlists, memberships, class packs, and comprehensive customer profiles into a single, intuitive dashboard for Australian dance, yoga, Pilates, and spa studios.
Crucially, Revively ensures all your client data, booking histories, and sensitive health intake forms are stored locally in Australia, fully complying with the Australian Privacy Principles (APPs). You can rest easy knowing your clients' information is protected right here at home.
Beyond data, Revively simplifies your financials. Our system natively handles 10% GST calculations across casual classes, memberships, and multi-resource packages, automatically issuing legally compliant Australian Tax Invoices directly to your clients. No more manual calculations or worries about ATO compliance.
And for your end-of-quarter sanity, Revively's 100% legal Xero integration is a game-changer. Automated two-way mapping of tax codes, revenue accounts, and liabilities ensures your quarterly Business Activity Statements (BAS) are flawless and audit-proof, completely removing those dreaded manual spreadsheet errors. This is how you run a GST compliant studio software that actually saves you time and stress.
Solo plans start at A$39 per month, Growth at A$99 per month, and Pro at A$199 per month, with competitive annual pricing available on our pricing page. Dance teachers looking for Mindbody alternatives Australia can explore how Revively specifically fits their needs on our dance studio page.
Frequently Asked Questions (FAQs)
How many clients do I need for cohort analysis to be useful?
There's no magic minimum number, but smaller cohorts inherently produce noisier, less reliable percentages. If your studio typically adds only a handful of new clients each month, consider grouping them by quarter or even by the type of entry offer they took. The goal is to identify trends across several cohorts, rather than fixating on any single, potentially misleading data point.
What is the difference between cohort retention and churn cohort analysis?
They're two sides of the same coin, using the exact same underlying data table. Retention shows the percentage of a cohort that is still active after a given period, while churn shows the percentage that has left. Essentially, churn is 100% minus retention. Churn visualisations often make it easier to immediately spot the specific months where clients are dropping away most rapidly.
Which time period should I use for a studio (monthly, quarterly, etc.)?
For studios running regular classes and memberships (like yoga, Pilates, dance, or recurring fitness), monthly cohorts are usually the most appropriate. If your clients visit less frequently, such as for one-off spa treatments or massages, a longer window (e.g., quarterly) might be more suitable so that a normal gap between visits isn't incorrectly flagged as churn. The key is consistency: use the same time window across all your cohorts.
Can I do this in a spreadsheet?
Absolutely! You can export your client IDs and visit dates from your studio software, assign each client a "cohort month" (their first visit month), and then use a pivot table. This will allow you to count unique clients by how many months have passed since their first visit. Finally, divide each count by the cohort's initial Month 0 size to calculate your retention percentages. While manual, it's a powerful exercise.
Sources
- Cohort analysis for businesses: Here's what to know | Stripe
- What is cohort analysis? | Metabase Glossary
- How to Build Retention Cohort Analysis Systems | LM Group
- Spa Client Retention: Rebooking vs. Completed Return Visits | American CSS
- Cohort Retention Analysis: How to Reduce Churn | Shopify
- Retention Cohort Analysis: How to Read It and Use It | Churnfree
- Cohort retention analysis: how to read the curves | Churn.io
- Conversion Rate Calculator | Gizmobench
Recommended for Australian Studio Owners
- APP 11 & ATO Audits: Your Australian Studio's Bulletproof Guide to Client Record Retention
- Make Every Session Pay: 4 Steps to Revenue per Class for Studios
- Stop the Revolving Door: Real-World Spa Retention Strategies for Australian Studios
- The Real Cost of Half-Empty Classes: Why Australian Studios Need to Master Attendance Rates