
Performance metrics and progress charts
Progress metrics let you track measurable client outcomes over time - body composition, strength numbers, pain scores, flexibility, and anything else your team records at check-in or review. Values appear on the customer profile, in full chart views, and (when enabled) in the customer portal so clients can log their own readings.
You will find setup under Dashboard - Progress. Growth and Pro plans include this module.
Looking for skill pathways, belts, swim stages, or roster grading? That is Revively Levels on the same Progress page (Levels tab) - not the Metrics catalog below.
The building blocks
Revively separates what you track from who you track it for and the readings themselves.
| Concept | What it is |
|---|---|
| Metric | A single measurable thing (name, unit, direction). Example: Body Weight in kg, direction Down means lower is better. |
| Variation | Optional sub-types under one metric (e.g. Bench Press with Barbell vs Dumbbell). Each variation can have its own chart line. |
| Metric group | A named bundle of metrics you assign together (e.g. Body Composition: weight, body fat, waist). |
| Assignment | Links a metric or whole group to one customer. New customers can receive default groups automatically. |
| Entry | One recorded value on a date. Staff log entries from the customer profile; clients can log their own in the portal when metrics are assigned. |
| Goal | A target value by a target date, shown on charts as a dashed reference line. |
| Review | A structured check-in session that can batch-log several entries and notes at once. |
Direction (Up vs Down)
Every metric has a direction that drives trend badges and portal congratulations:
- Up - higher values are better (reps, flexibility, recovery score).
- Down - lower values are better (body weight, pain level, resting heart rate).
When a new entry beats the previous reading in the right direction, staff and portal UIs can surface a positive trend.
Set up your metric catalog
Open Progress and use the Metrics tab to manage definitions.
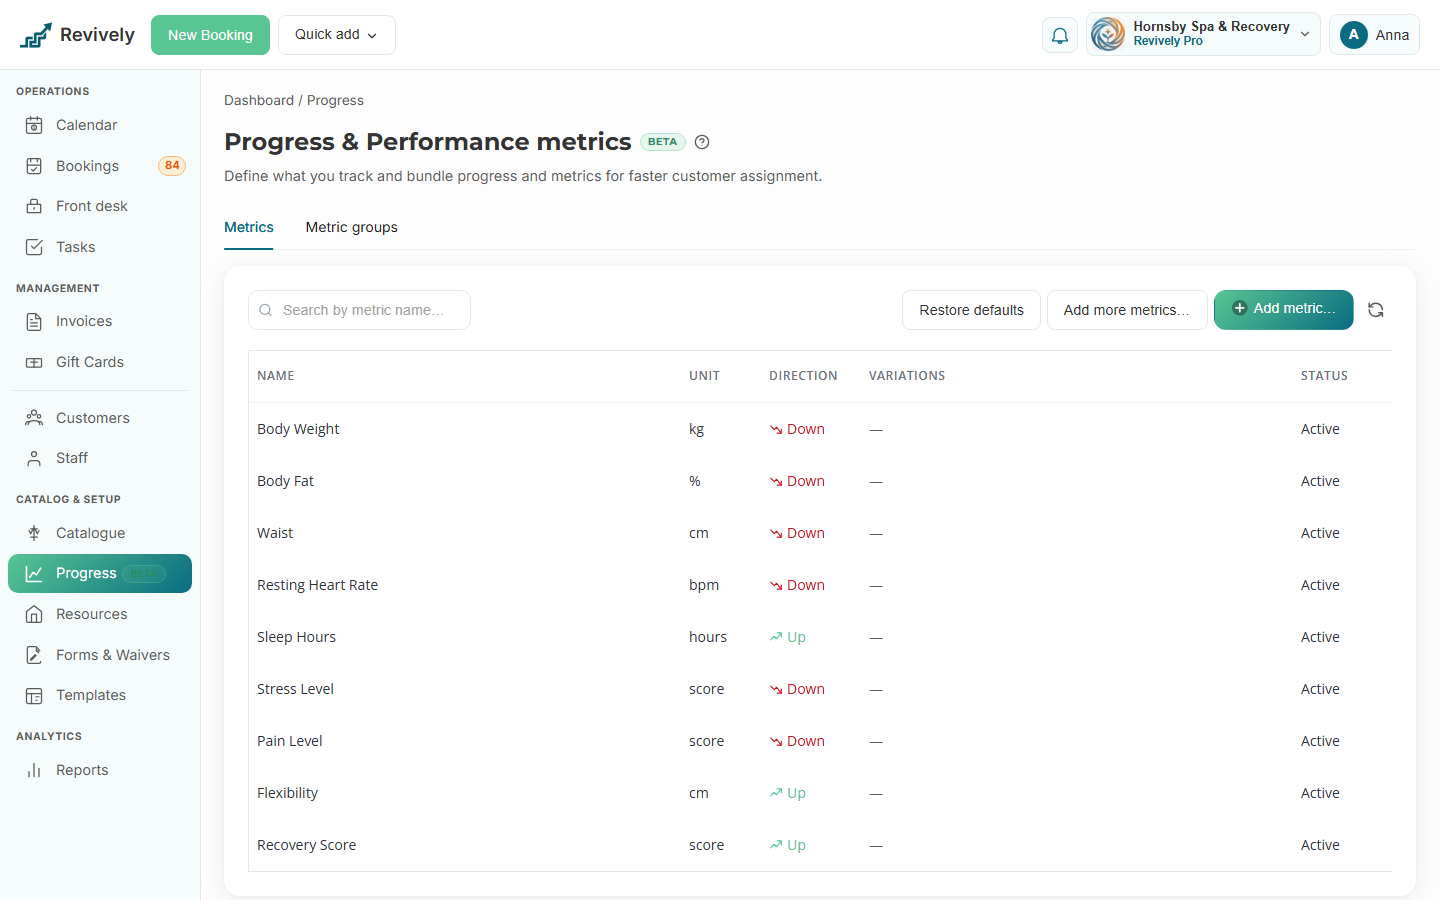
Each row shows the metric name, unit, direction, variations, and status. From here you can:
- Add metric… - create a custom definition (name, unit, up/down, optional variations).
- Add more metrics… - import from the vertical catalog (spa, gym, clinic presets).
- Restore defaults - add any missing seed metrics and groups for your business type without removing custom rows.
Archived metrics stay in the list for history but cannot be assigned to new customers.
Bundle metrics with groups
Switch to the Metric groups tab to create sets you assign in one step.
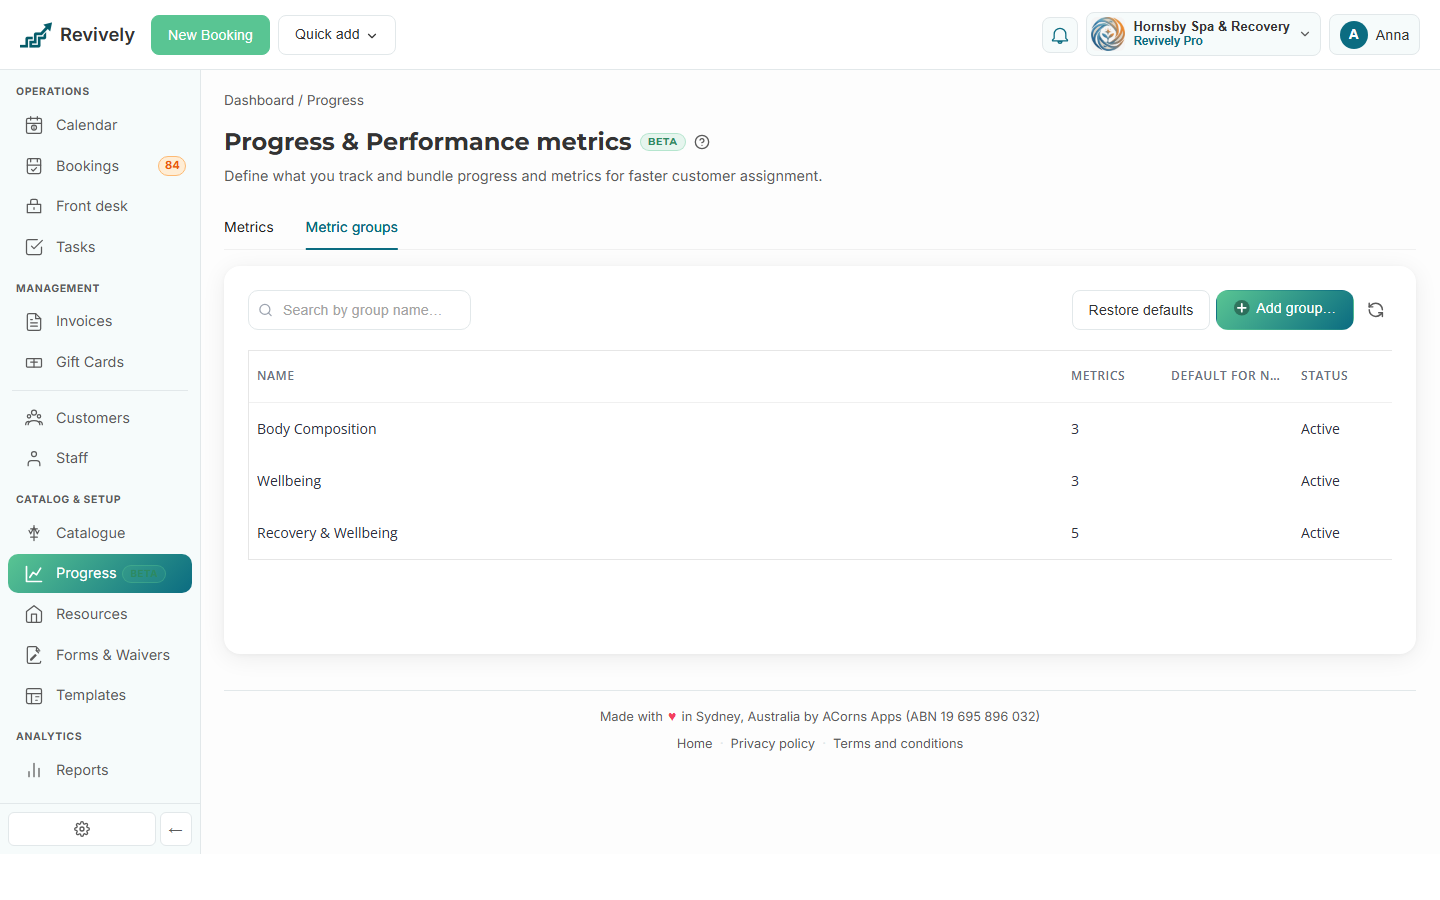
When editing a group you choose which metrics belong to it and optionally mark Default for new customers. Customers created after that flag is set receive the group automatically (when Progress is enabled on your plan).
Use groups when your front desk always tracks the same panel - initial assessment, monthly review, or program-specific bundles.
Assign and log on a customer
Open any customer profile. In the Performance metrics accordion you can:
- Assign individual metrics not yet on the profile.
- Log metric - record a value, date, optional variation, and tags.
- Set goal - add a target line for charting.
- Review - run a multi-metric check-in in one drawer.
Recent entries and active goals appear inline; choose View all for the full chart workspace.
Full chart view
The customer metrics page shows a line chart, date-range presets (1M, 3M, 6M, 1Y, All), optional variation filter, and an entry table.
Use Add entry to open the Log metric drawer (metric, value, date, optional variation and tags) without leaving the page.
Customer dashboard chart
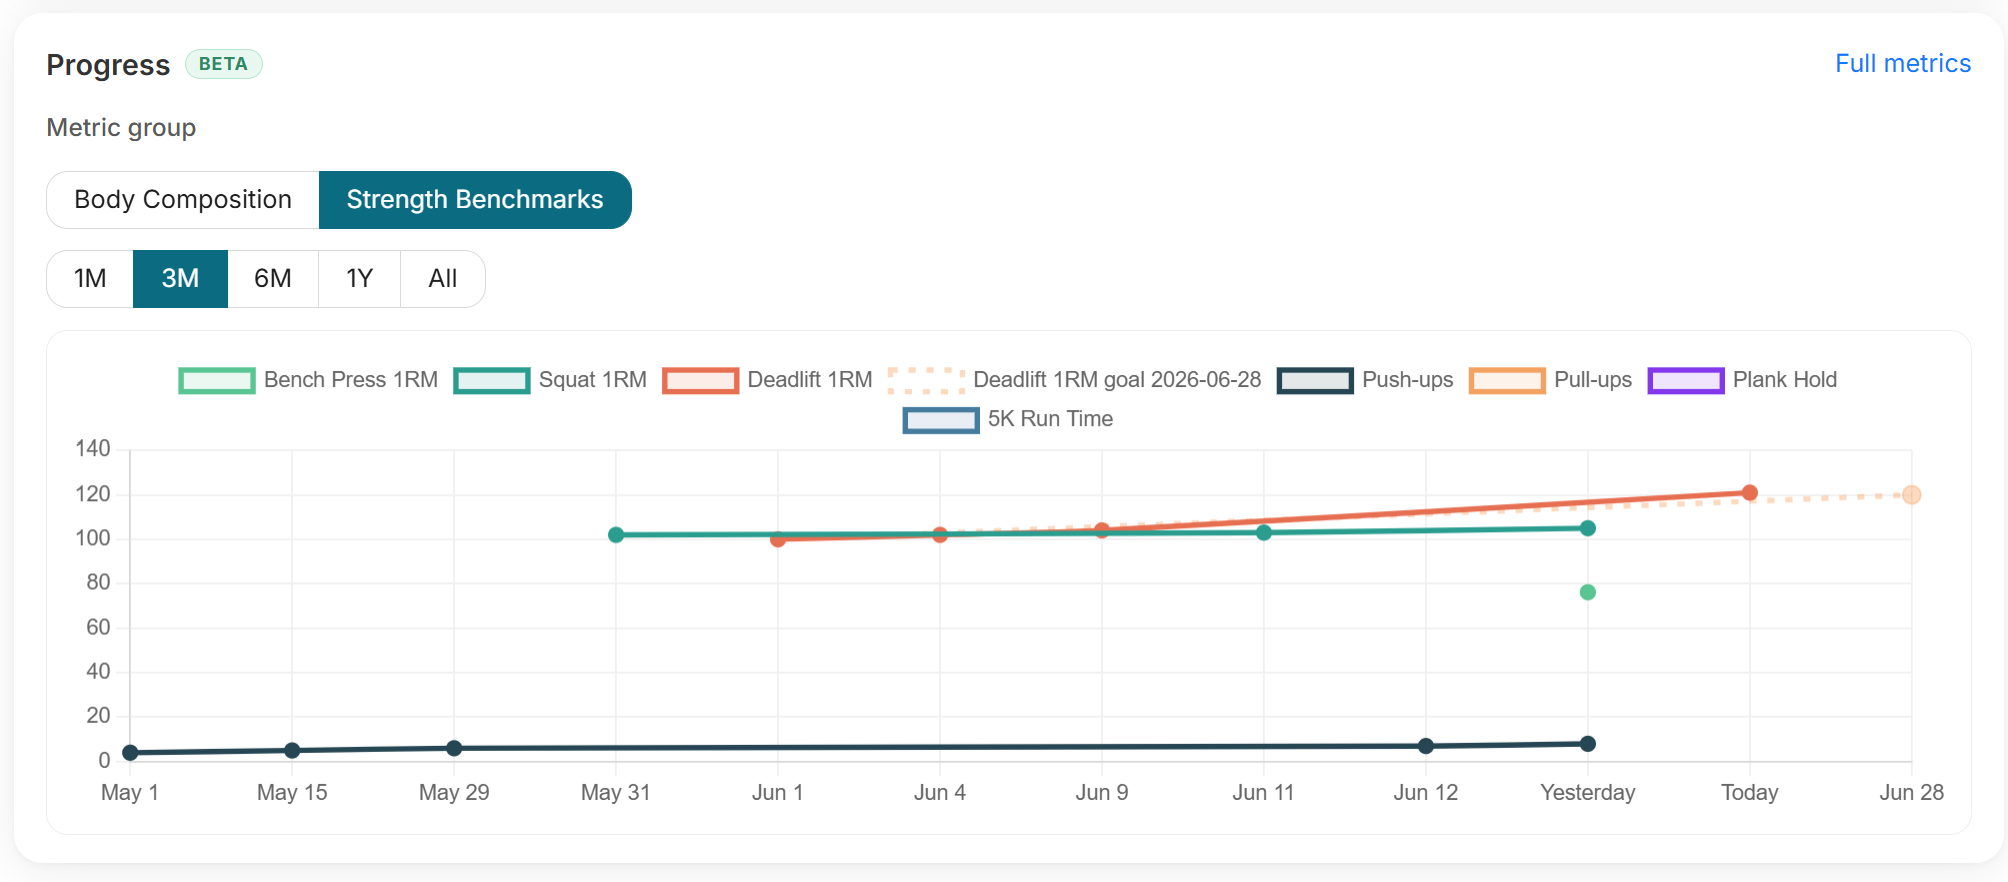
On the customer dashboard (open a customer from the list), a Progress card charts every metric in the selected assigned group as separate coloured lines. Switch groups when the customer has more than one bundle assigned.
How charts work
Charts are built from entries in the selected date range:
- Each entry plots as a point on its metric's line (or variation-specific series when filtered).
- Goals render as horizontal dashed lines at the target value across the range.
- Reviews appear as markers on the timeline so you can see when a formal check-in happened.
- Multiple metrics in one group use distinct colours with a legend.
Preset buttons snap the range to the last month, three months, six months, year, or all time. Custom from/to dates are available on the full metrics page.
Empty charts simply mean no entries yet in that range - log the first reading and the line appears on the next refresh.
Customer-entered values (portal)
When a customer has assigned metrics and portal access, they see Progress in the portal navigation. They can:
- Browse assigned metrics grouped like your staff-facing bundles.
- Log a value and date for metrics you allow self-entry.
- Open a detail view with the same style of chart and recent history.
- Edit or delete entries they submitted themselves (staff entries are managed on your side).
On mobile, the portal Progress screen lists every assigned metric with the latest reading and trend at a glance.
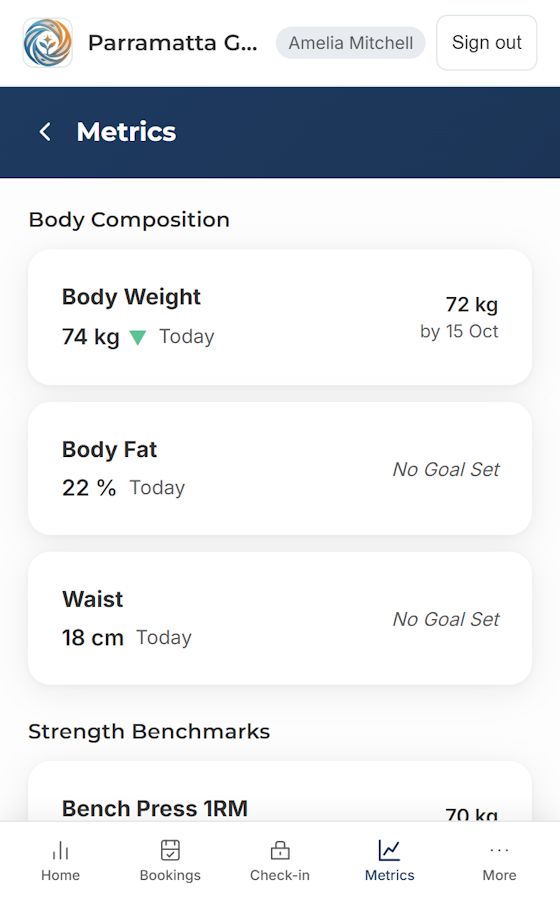
Tapping a metric opens its detail page: line chart, active goals, recent entries, and actions to log or edit their own readings.
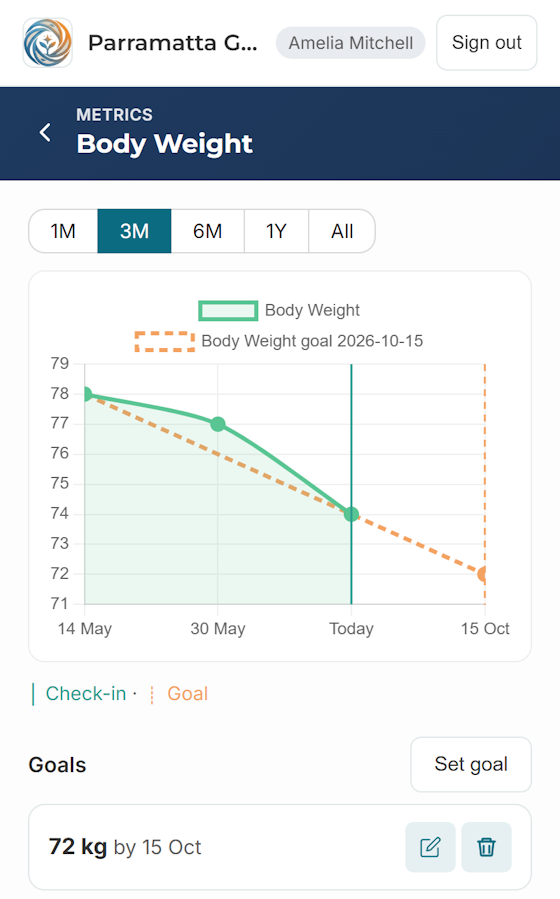
Portal logging sets entered by customer on the entry. Staff see the full audit trail on the customer profile.
Share a direct link or QR from the metric definition drawer if you want a client to jump straight to one metric in the portal.
Typical workflow
- Confirm defaults under Progress - Metrics and Metric groups (restore defaults if you just enabled the module).
- Flag the right groups as Default for new customers or assign groups manually on existing profiles.
- Log baseline entries at intake or first session.
- Set short-term goals where programs need targets.
- Use Review after 4-12 weeks to batch-update several metrics and notes.
- Point clients to the portal if they track homework readings between visits.
Check-ins tab and Emma
On Customers - Progress Reviews (Check-ins tab), triage clients by overdue, due this week, never reviewed, or recent review - same filters Emma uses when you ask who needs a progress review? or who had recent PRs?
Emma can also assign preferred staff and write or update progress review notes and goals from chat (she drafts polished text from your bullets, then you confirm). Numeric metric values still belong in the Check-in UI - see Meet Emma.
Tips
- Keep variation names short - they appear in chart legends and portal pickers.
- Prefer groups over one-by-one assignment when every new client gets the same panel.
- Use consistent recording dates (e.g. always the morning of a session) so trend lines stay meaningful.
- Archive obsolete metrics instead of deleting if historical charts must stay intact.